Question 3: Massachusetts Spending - Public Salaries
In the midst of the Question 3 debate, many reluctant citizens demand to see fraud and waste so they can feel comfortable about cutting the sales tax. As if this fraud and waste is neatly spelled out on page 666 in the Comprehensive Annual Financial Report or cataloged by the Department of Fraud and Waste. Perhaps we should just called Deval and ask him how many billions we are wasting and whether he can point us to the right department. What you are asking for IS NOT VISIBLE!!
The best we can do, for those willing to take the time and energy is to piece together the available data and make a reasonable conclusion on what is happening. So far, in our previous look at the spending levels of MA from 2002-2009 we have concluded the following:
Chart showing spending and incomes.
From 2002 to 2009, spending jumped from 34.3 Billion to 49.4 Billion. This represents a 44% increase. Using a rudimentary inflation calculator, we can determine that inflation within that time was 19%. In total, MA state spending went up a pretty astonishing 25%!
At the same time, as the previous analysis demonstrated MA incomes remained flat. The story of the income picture is incomplete, because we are interested in specifically private income as there is a strong possibility that private income actually went down. This is especially damaging in the face of not only the worst recession in 80 years, but the mounting taxation demand from both the local, state and federal level.
Fraud and waste are certainly nice catch words, but just because we *feel* it has to be there, does not mean we can actually prove it. Previously we looked at Medicaid and the fact that Medicaid expenditures almost doubled from 5.9 to 10.8 Billion (refer to above chart). With a mere 20% case load increase, there is almost certainly a great deal of waste.
To further continue the discussion on income and the disparity of public and private pay, let us focus our attention on why MA state spending is growing at such a dizzying pace. Salaries. I have taken a look at 7 arbitrary departments/organizations within Massachusetts and compiled them into a visually digestible chart. Let us compare the differences between 2003 and 2009, keep in mind that overall incomes in MA have remained flat. (Source of data: MassOpenBooks)
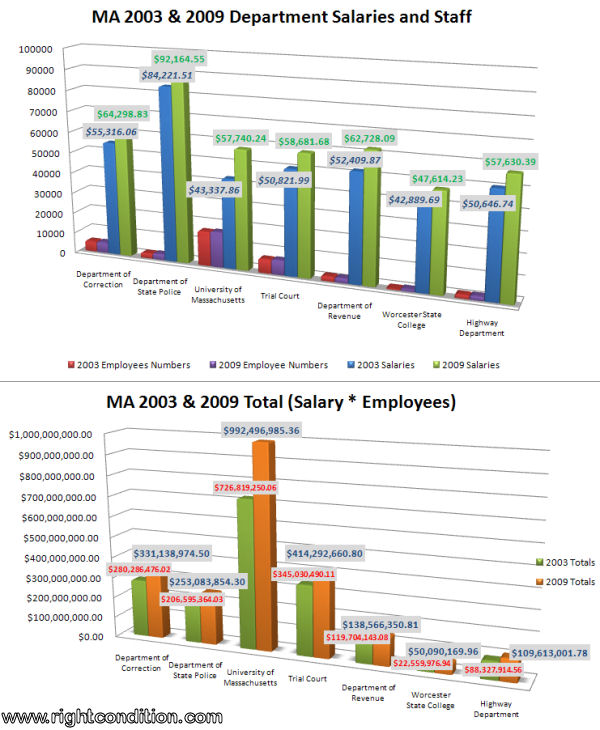
Explanation: Above are 7 departments with their 2003 employee numbers/salaries and 2009 employee numbers/salaries. Below are the totals spent by each department on salaries alone for 2003 and 2009. To achieve the total, I simply multiplied the average salary by the number of employees.
There are two numbers that are not present on the chart. The total amount of money that 7 departments use on salaries alone.
2003: 1.78 Billion
2009: 2.28 Billion
A 28% increase in total salary payments without a significant increase in number of employees, while our income remained flat!
To put things into perspective. The amount of money that we as citizens save collectively from this tax cut could be just about 2.5 Billion or in percentage terms, 5% of what MA spent in 2009! Therefore MA spent almost 5% of their budget on salaries of 7 departments. UMASS alone spent almost one billion dollars on salaries, representing nearly half of what MA spends on the university (2.5 billion). This is of course on top of the incredibly insulting tuitition hikes that have outpaced not only inflation, but medical costs. Deep sigh.
Yet opposition to Question 3 maintains the idea that our budget is hurting and that tax cuts must result in cuts to services. This is despite the fact local aid has remained at 5.2 Billion from 2002. In other words, none of our services saw an increase in expenditures even as total spending grew by 25% and salaries of 7 departments jumped by 28%.
There are plenty of places where public employees, departments and administrative offices can make the proper sacrifices to return to 2008 spending levels. By good measure, spending should go back to pre-housing bubble levels before the insanity kicked in and MA decided to throw all fiscal responsibility to the wind. That is, 34 billion in total spending with salaries adjusting to 2003 levels as well, a perfectly reasonable request considering that our salaries have remained flat yet we are the ones paying for all of this.
Just some food for thought. By the way, none of this includes pensions - another can of giant worms.
The best we can do, for those willing to take the time and energy is to piece together the available data and make a reasonable conclusion on what is happening. So far, in our previous look at the spending levels of MA from 2002-2009 we have concluded the following:
From 2002 to 2009, spending jumped from 34.3 Billion to 49.4 Billion. This represents a 44% increase. Using a rudimentary inflation calculator, we can determine that inflation within that time was 19%. In total, MA state spending went up a pretty astonishing 25%!
At the same time, as the previous analysis demonstrated MA incomes remained flat. The story of the income picture is incomplete, because we are interested in specifically private income as there is a strong possibility that private income actually went down. This is especially damaging in the face of not only the worst recession in 80 years, but the mounting taxation demand from both the local, state and federal level.
Fraud and waste are certainly nice catch words, but just because we *feel* it has to be there, does not mean we can actually prove it. Previously we looked at Medicaid and the fact that Medicaid expenditures almost doubled from 5.9 to 10.8 Billion (refer to above chart). With a mere 20% case load increase, there is almost certainly a great deal of waste.
To further continue the discussion on income and the disparity of public and private pay, let us focus our attention on why MA state spending is growing at such a dizzying pace. Salaries. I have taken a look at 7 arbitrary departments/organizations within Massachusetts and compiled them into a visually digestible chart. Let us compare the differences between 2003 and 2009, keep in mind that overall incomes in MA have remained flat. (Source of data: MassOpenBooks)
Explanation: Above are 7 departments with their 2003 employee numbers/salaries and 2009 employee numbers/salaries. Below are the totals spent by each department on salaries alone for 2003 and 2009. To achieve the total, I simply multiplied the average salary by the number of employees.
There are two numbers that are not present on the chart. The total amount of money that 7 departments use on salaries alone.
2003: 1.78 Billion
2009: 2.28 Billion
A 28% increase in total salary payments without a significant increase in number of employees, while our income remained flat!
To put things into perspective. The amount of money that we as citizens save collectively from this tax cut could be just about 2.5 Billion or in percentage terms, 5% of what MA spent in 2009! Therefore MA spent almost 5% of their budget on salaries of 7 departments. UMASS alone spent almost one billion dollars on salaries, representing nearly half of what MA spends on the university (2.5 billion). This is of course on top of the incredibly insulting tuitition hikes that have outpaced not only inflation, but medical costs. Deep sigh.
Yet opposition to Question 3 maintains the idea that our budget is hurting and that tax cuts must result in cuts to services. This is despite the fact local aid has remained at 5.2 Billion from 2002. In other words, none of our services saw an increase in expenditures even as total spending grew by 25% and salaries of 7 departments jumped by 28%.
There are plenty of places where public employees, departments and administrative offices can make the proper sacrifices to return to 2008 spending levels. By good measure, spending should go back to pre-housing bubble levels before the insanity kicked in and MA decided to throw all fiscal responsibility to the wind. That is, 34 billion in total spending with salaries adjusting to 2003 levels as well, a perfectly reasonable request considering that our salaries have remained flat yet we are the ones paying for all of this.
Just some food for thought. By the way, none of this includes pensions - another can of giant worms.

Comments
Post a Comment